
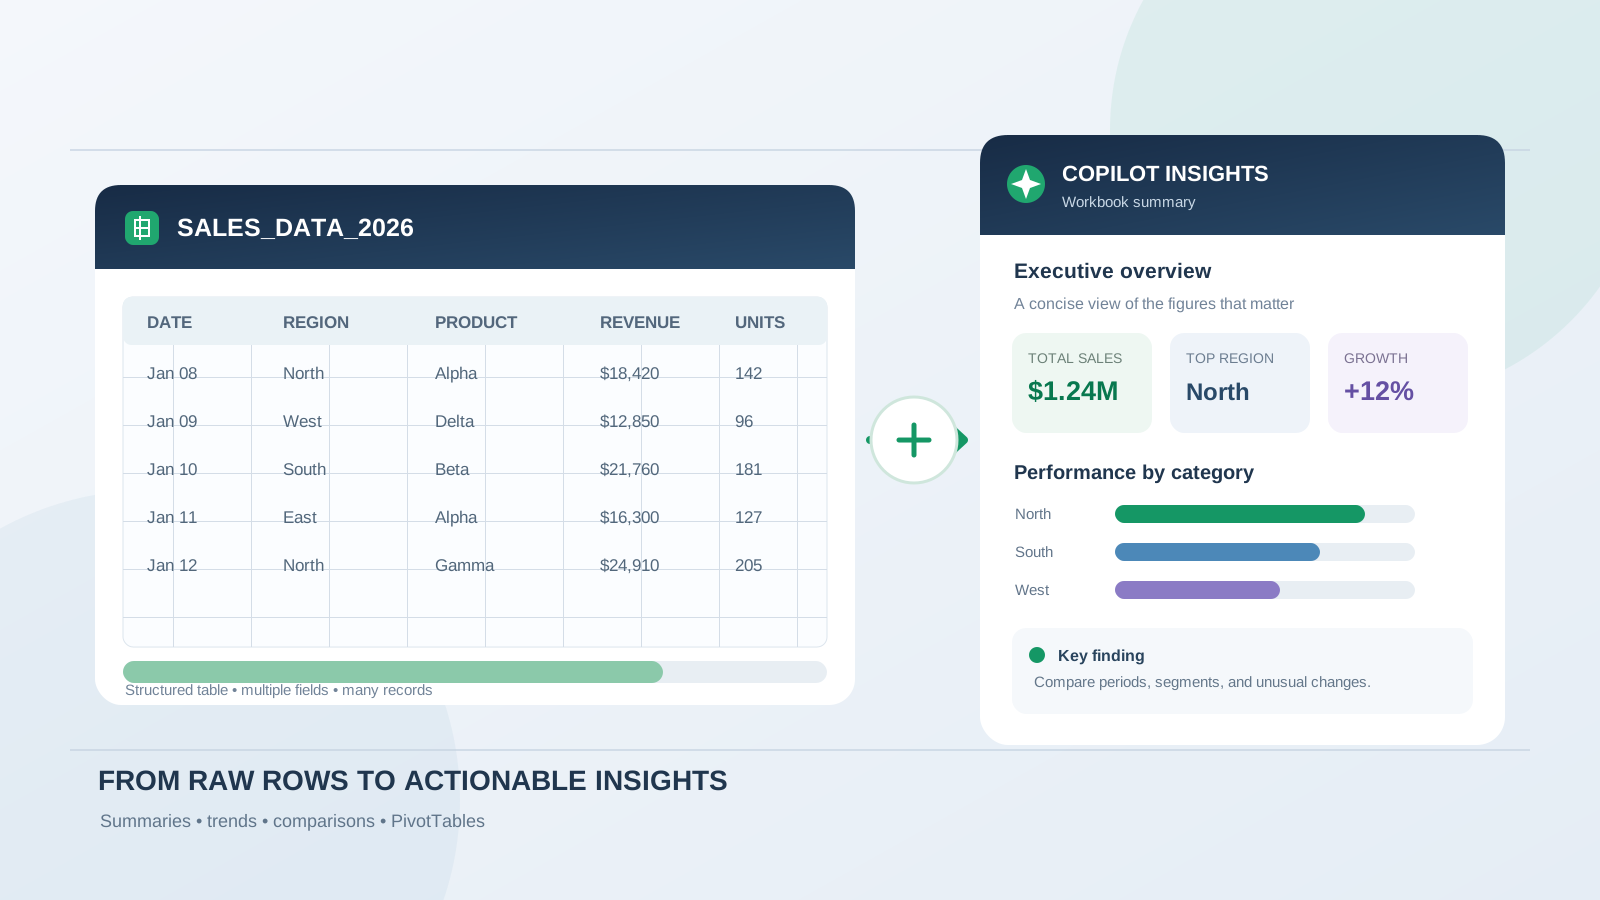
A large Excel workbook can contain thousands of rows, multiple categories, dates, customer records, and figures that are difficult to interpret by scanning the sheet. Microsoft Copilot in Excel can help summarize that data in plain language, surface trends and outliers, compare groups, and turn selected findings into charts or PivotTables.
The most reliable approach is not to ask Copilot for a vague overview and accept the first answer. Prepare the data, define the questions the summary must answer, request specific calculations and comparisons, and then verify the results against the workbook. This guide walks through that process, with practical prompts you can adapt to sales reports, financial tracking sheets, inventory records, customer feedback, and operational datasets.
What Copilot in Excel can summarize
Copilot in Excel can answer questions about workbook data and present insights in different forms. Depending on the task and the Copilot experience available in your Excel environment, it can help you:
- Produce a plain-language overview of a table or data range.
- Compare totals, averages, and performance across regions, products, teams, or periods.
- Identify trends, unusual values, and potential outliers.
- Create a PivotTable to summarize data by one or more fields.
- Generate charts that make comparisons easier to understand.
- Summarize text such as survey responses, customer reviews, and feedback, including recurring themes and sentiment.
- Suggest formulas, summary rows, or additional calculated columns.
Microsoft describes these capabilities in its Copilot data insights guide and its Copilot in Excel overview.
The exact options you see can depend on your Microsoft 365 subscription, organization settings, platform, and the Copilot experience being rolled out to your account. Treat the examples below as prompts to adapt, not a guarantee that every account will display an identical interface. If you need a broader introduction to formulas, charts, and general workbook tasks, read How to Use Microsoft Copilot in Excel: Formulas, Data Analysis, and Charts.
Step 1: Prepare the large dataset before asking for a summary
The quality of an AI-generated summary depends heavily on the structure and meaning of the source data. Before opening Copilot, check the workbook.
Convert the data into a clear Excel table
For a typical dataset:
- Open the workbook in Excel.
- Select a cell inside the dataset.
- Use Insert > Table, or the table-formatting option available in your Excel version.
- Confirm that the table has headers.
- Give the table a meaningful name if you work with several tables.
Use one header row with unique, descriptive column names. Examples include Order Date, Region, Product Category, Units Sold, and Net Revenue. Avoid blank headers, merged cells inside the data, and multiple header rows.
A well-structured table makes it easier to tell Copilot which fields to analyze. Microsoft also recommends naming the columns or ranges in your prompts when you want more precise results.
Check the meaning and consistency of the fields
Before summarizing, confirm that:
- Dates are stored as dates rather than inconsistent text strings.
- Revenue and quantity columns contain numeric values.
- Category names use consistent spelling.
- Blank cells and missing values are understood.
- Canceled orders, refunds, and test records are handled intentionally.
- Each row represents the unit of data you think it represents, such as one order line or one customer response.
If the workbook contains several sheets, identify which table or range is the source for each question. Do not assume that similar-looking columns across different sheets have identical definitions.
For a separate walkthrough of finding duplicates, inconsistent values, and other quality issues, see How to Use Microsoft Copilot in Excel to Find Data Errors.
Step 2: Open Copilot and request an initial overview
Open the workbook and select the Copilot button in Excel. Depending on your version, it may appear in the ribbon or in the Copilot pane.
Start with a request that names the table and the information you want summarized. For example:
Summarize the SalesData table. Give me the total revenue, total units sold, number of records, top five product categories by revenue, and the three most important patterns. Use the column names in the table and state the period covered by the data.
This is more useful than simply asking, “What does this data show?” It specifies the source, the measures, the ranking, and the expected output.
Review the response before moving on. Check whether Copilot has used the intended date range, included the correct records, and interpreted the revenue field correctly. If the workbook contains more than one relevant table, name the intended table explicitly.
Step 3: Ask Copilot to summarize the dataset by category
An overall total can hide important differences. A dataset may show higher total revenue while one region is declining, or a product category may have fewer orders but a higher average order value.
Ask Copilot to compare the groups that matter to your analysis.
Regional performance prompt
Compare total revenue, order count, and average order value by Region. Rank the regions from highest to lowest revenue, identify the largest difference between regions, and summarize the main findings in five bullet points.
Product category prompt
Summarize Units Sold and Net Revenue by Product Category. Identify the top five categories by revenue and explain whether the highest-revenue categories are also the highest-volume categories.
Monthly performance prompt
Group the records by month using Order Date. Show monthly revenue, month-over-month change, and the three strongest and weakest months. Explain any visible pattern without assuming a cause that is not present in the data.
These prompts make the comparison criteria explicit. If Copilot returns a result that is too broad, follow up with a narrower request such as, “Show only the last 12 months” or “Compare the North and West regions using average order value.”
Step 4: Create a PivotTable for a structured summary
A PivotTable is useful when you need to inspect the numbers behind a written summary. Copilot can help create one from a dataset and organize the information by fields you specify.
For example, try:
Create a PivotTable from SalesData with Month in rows, Region in columns, and the sum of Net Revenue as values. Sort the months chronologically and include a grand total.
For a product-focused report:
Create a PivotTable showing Product Category in rows, with Sum of Net Revenue, Sum of Units Sold, and Count of Order ID as values. Sort by Sum of Net Revenue from largest to smallest.
Check the PivotTable fields and aggregation methods. A field that should be summed may be counted instead, and an average may be more appropriate than a total for some measures. Verify the date grouping and grand totals against the source table.
Microsoft’s guide to visualizing data with Copilot in Excel includes examples of asking Copilot to create PivotTables and charts from workbook data.
Step 5: Turn the findings into a concise chart or report
A useful dataset summary should make the important comparisons visible. Once you understand the figures, ask Copilot for a chart that matches the question.
Examples:
Create a column chart comparing total revenue by Region. Use clear category labels and a descriptive chart title.
Create a line chart showing monthly revenue over time. Keep the months in chronological order and include data labels.
Create a bar chart of the ten product categories with the highest Net Revenue, sorted from highest to lowest.
You can also ask for a written executive summary:
Write an executive summary of the SalesData table in 150 to 200 words. Include the reporting period, total revenue, strongest region, leading product category, two important trends, and one limitation in the data. Do not invent explanations for changes that the workbook does not establish.
Keep the chart and summary focused. A chart with too many categories or a report containing every available metric can make a large dataset harder, not easier, to understand.
Step 6: Summarize text-heavy datasets such as surveys and reviews
Not every large Excel dataset contains only numbers. Customer comments, survey answers, support tickets, and product reviews may require a different type of summary.
Copilot can help identify recurring themes and sentiment in text data. For example:
Review the Customer Feedback column. Group similar comments into major themes, estimate the number of comments in each theme, and provide a short explanation with representative examples.
Or:
Summarize the Survey Response column. Identify the most common positive themes, the most common complaints, and any recurring requests. Separate direct observations from interpretations.
Microsoft’s documentation explains that Copilot can summarize large sets of text, identify themes and sentiment, and add results to a workbook as a new column. It also describes a way to inspect the source data referenced in an analysis: hover over the superscript number shown with the result.
Do not treat sentiment labels or theme counts as unquestionable facts. Review the underlying comments, especially when responses are ambiguous, sarcastic, duplicated, or written in different languages.
Step 7: Verify the summary before using it
An AI-generated summary is a starting point for analysis, not an audited report. Check the most important claims against the workbook.
Use this verification process:
- Confirm the scope. Check the table, date range, filters, and included sheets.
- Recalculate key totals. Compare Copilot’s totals with Excel formulas or a PivotTable.
- Check the aggregation. Confirm whether each measure should use sum, average, count, or distinct count.
- Inspect rankings. Verify the top and bottom categories, including ties.
- Review outliers. Determine whether an unusual value is a real event, a data-entry issue, or a legitimate exception.
- Check the chart. Confirm its source range, labels, units, and time order.
- Trace text insights. Read the original comments behind important themes or sentiment claims.
For important business reporting, retain the source workbook and document the filters, assumptions, and calculation definitions used. Do not rely on a fluent paragraph as proof that the underlying calculations are correct.
Microsoft explicitly advises users to review, edit, and verify AI-generated content in Excel. Its Copilot FAQ also warns that generated insights and formulas can be inaccurate or inappropriate.
Practical Copilot prompts for large Excel datasets
Use these prompts as starting points. Replace the example table and field names with the exact names in your workbook.
| Goal | Prompt |
|---|---|
| Overall summary | Summarize the [TableName] table. Report the record count, date range, key totals, and five main findings. |
| Revenue analysis | Calculate total and average revenue by Region and rank the results. |
| Time trends | Summarize monthly revenue and identify the largest increases and decreases. |
| Product comparison | Compare Product Category by revenue, units sold, and order count. |
| Customer analysis | Group customers by [Segment] and compare total revenue and average order value. |
| Outlier review | Identify unusually high or low values in [Metric] and show the related records. |
| Survey analysis | Group [FeedbackColumn] into recurring themes and summarize the evidence for each theme. |
| Executive report | Write a concise report with key metrics, trends, exceptions, and limitations. |
| PivotTable | Create a PivotTable with [Category] in rows and Sum of [Metric] in values. |
| Chart | Create a chart comparing [Metric] across [Category], sorted from highest to lowest. |
For more effective results, Microsoft recommends specific prompts, naming relevant columns or ranges, starting with a broad question and refining it, and asking follow-up questions when the first result is incomplete. See Copilot in Excel tips.
What to do if Copilot cannot summarize the whole dataset
If Copilot does not return the expected result, do not assume that the workbook is defective or that every Excel account has the same analysis limits. First check the structure of the data, the table or range being referenced, your account’s available Copilot features, and any organization-level restrictions.
For a very large or complex workbook:
- Filter the data to the period or business segment relevant to the question.
- Split unrelated analyses into separate, clearly defined requests.
- Use Excel tables and PivotTables to create verifiable intermediate summaries.
- Consider Power Query to combine, clean, and reshape source data before analysis.
- If the task requires analysis across many datasets or a governed reporting model, consider whether Power BI is a more suitable reporting layer.
Some Copilot experiences are designed for structured tables or table-like ranges rather than arbitrary unstructured worksheet content. Microsoft’s documentation for direct answers to data analysis questions describes the supported structured-data workflow and explains that the analysis response can include a summary, calculations, and optional visualizations.
Also, do not build a new workflow around the old =COPILOT() worksheet function. Microsoft states that this preview function was discontinued in Excel on September 14, 2026. The Copilot pane remains the supported route for comparable AI-assisted tasks; see Microsoft’s COPILOT function notice.
Frequently asked questions
Can Copilot summarize thousands of rows in Excel?
Copilot can help analyze structured workbook data and produce summaries, comparisons, trends, and other insights. The practical result depends on the data structure, the Copilot experience and license available to your account, and the complexity of the request. For large workbooks, use clear tables, specify the relevant fields, and verify the totals.
Can Copilot summarize Excel data by month or region?
Yes. Ask it to group the data by a date field or category field, then specify the measure to calculate. For example, request monthly revenue or total units sold by region. Check the grouping and aggregation in the resulting PivotTable or summary.
Can Copilot create a PivotTable from a large dataset?
Copilot can help create PivotTables from workbook data. Specify the fields for rows, columns, and values, along with the calculation and sort order you need. Review the result to confirm that the fields and aggregation are correct.
Can Copilot summarize customer feedback in Excel?
Yes. Copilot can help summarize text such as survey responses, customer reviews, and feedback, identify recurring themes and sentiment, and add analysis results to a workbook. Review the original comments before using the findings in a business decision.
Does Copilot automatically make changes to my workbook?
The available behavior depends on the Copilot mode and task. Excel offers experiences for editing, planning, and chat-based analysis. Check the mode before submitting a request, review proposed changes, and verify the workbook after applying edits.
Is Copilot’s Excel summary always accurate?
No. AI-generated summaries can misinterpret data or produce inaccurate insights. Validate important numbers, filters, rankings, and conclusions against the source workbook before sharing or relying on the report.
Final takeaway
Microsoft Copilot can make a large Excel dataset easier to understand by turning structured rows into summaries, category comparisons, PivotTables, charts, and plain-language findings. The best results come from clean tables, precise prompts, and a clear definition of the metrics being analyzed.
Use Copilot to accelerate the first pass, then verify the calculations and inspect the source records. That combination makes AI-assisted Excel reporting more useful, transparent, and dependable.