
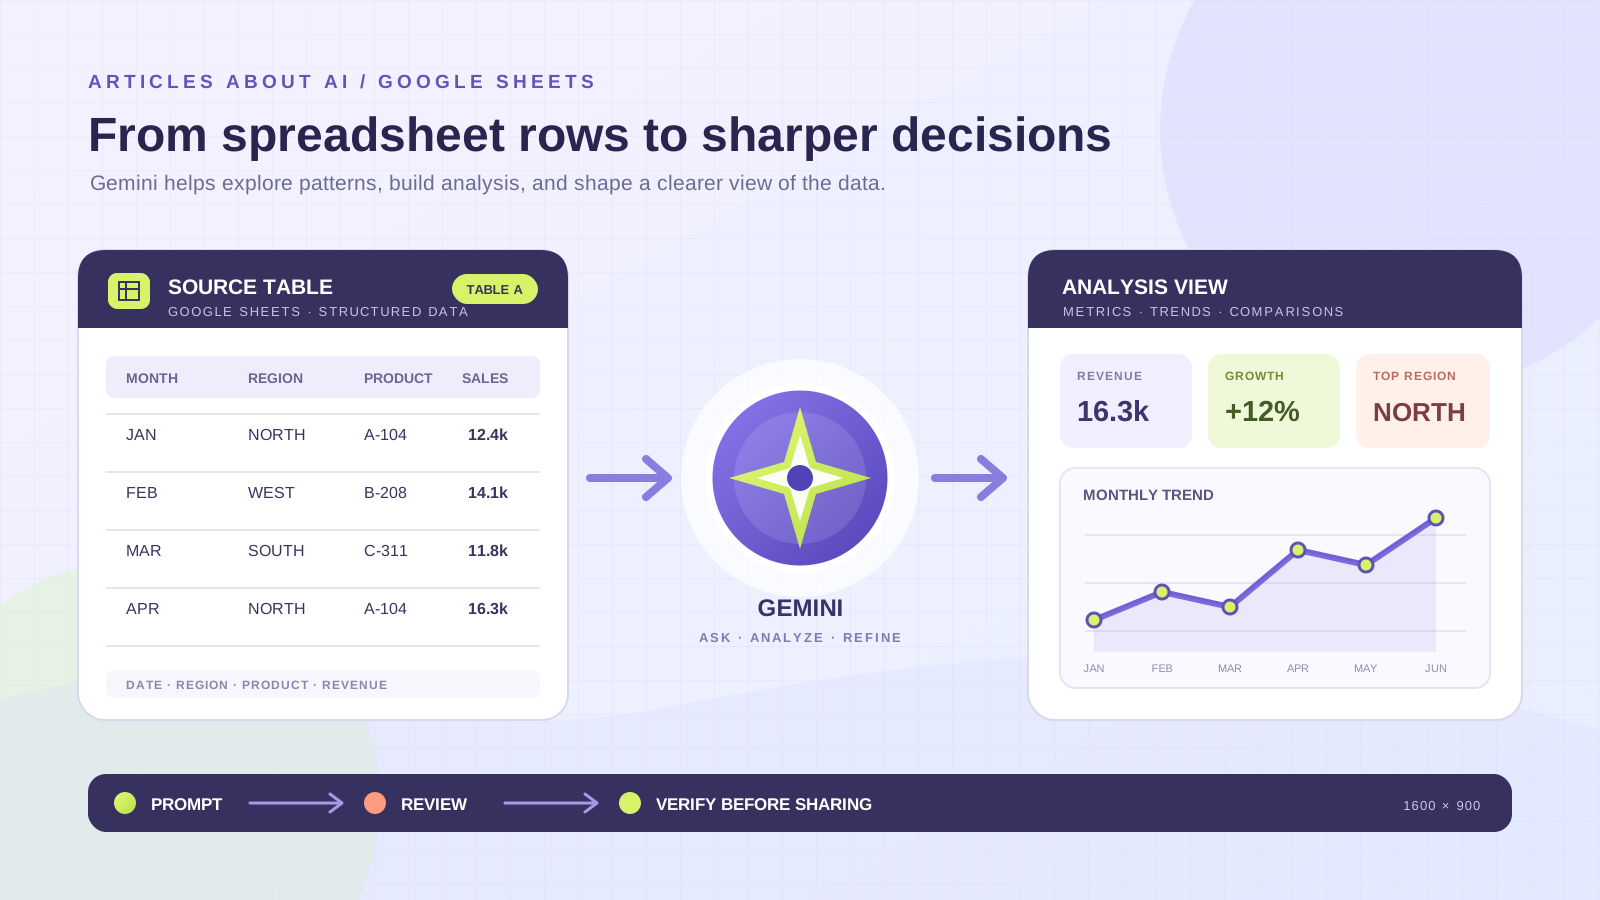
A spreadsheet can hold thousands of useful facts and still make a simple business question difficult to answer. Sales may be split across regions, dates may be stored in inconsistent formats, and important patterns may be hidden in separate tables or tabs. Gemini in Google Sheets can help analyze spreadsheet data by summarizing a table, identifying trends, generating formulas, creating charts and pivot tables, and carrying out selected editing tasks through natural-language prompts.
The strongest results come from treating Gemini as an analytical assistant rather than an authority. You define the question, explain what the columns mean, select the relevant data, and review the proposed work before applying it. You then check the formulas, totals, chart labels, and assumptions against the source spreadsheet.
This guide explains how to use Gemini in Google Sheets for practical data analysis, from preparing a workbook to building a dashboard. It also covers the AI function, multiple-table analysis, Sheets canvas, BigQuery data, feature availability, and the checks that help prevent a plausible-looking but incorrect result.
What can Gemini do with spreadsheet data?
Google’s current documentation describes several related capabilities inside Google Sheets. Depending on the account, plan, language, and feature rollout, Gemini can:
- Summarize a spreadsheet and explain what its data contains.
- Answer questions about trends, comparisons, and selected ranges.
- Generate formulas from natural-language instructions.
- Create tables, charts, and graphs.
- Build pivot tables and apply filters, sorting, and conditional formatting.
- Add dropdowns, checkboxes, rows, columns, and number formats.
- Fill ranges and categorize or summarize text with the AI function.
- Help diagnose formula errors and suggest corrections.
- Build an interactive Sheets canvas for supported accounts.
The Google Docs Editors Help guide to collaborating with Gemini in Sheets documents these workflows and the actions available in the side panel. Google’s April 22, 2026 announcement also describes a more advanced experience for building and editing entire spreadsheets through multi-step natural-language requests, including tables, formulas, pivot tables, and charts.
It is useful to distinguish three tools that can appear in the same workflow:
| Feature | Best use | Important distinction |
|---|---|---|
| Gemini side panel | Ask questions, analyze data, generate formulas, charts, and spreadsheet actions | Works with the spreadsheet context you select and the actions available to your account |
| AI function in cells | Generate, summarize, or categorize text from a supplied range | Returns text and only receives the data you pass to the function |
| Sheets canvas | Turn one sheet tab into an interactive dashboard or mini-application | A separate visual layer with its own availability and data-size limitations |
They are related, but they are not interchangeable. Choose the one that matches the task instead of expecting a single prompt to perform every kind of analysis.
Check access and file compatibility first
Gemini in Sheets requires an eligible Google Workspace or Google AI plan for the documented features. Workspace administrators may also control access through Gemini and smart-feature settings. If the Gemini icon or a particular action is missing, the cause may be the account’s plan, administrator settings, language, or feature availability rather than a problem with the spreadsheet.
For the most reliable experience, use a native Google Sheets file. Google’s Help Center says the newer Build experience works best with standard Sheets files. If you start with an Excel workbook, open it in Sheets and use File → Save as Google Sheets before relying on Gemini-specific features. Keep the original Excel file as a backup until you have checked the converted workbook.
The feature set is not identical across every account. Some capabilities have their own rollout and language requirements. For example, Google announced expanded language support for building and editing spreadsheets on June 18, 2026, while the current Sheets canvas Help page still describes canvas as an English-language feature. Check Google’s supported languages for Workspace with Gemini and the relevant feature page before planning a workflow around a particular language.
For a current overview of advanced spreadsheet creation, read Google’s Build or edit entire spreadsheets with Gemini in Sheets instructions. For an interactive dashboard, see the separate Create a Sheets canvas guide.
Step 1: Prepare the spreadsheet before asking questions
Gemini can help organize data, but it cannot reliably infer every business rule from a messy workbook. A short preparation pass improves the quality of the analysis and makes mistakes easier to detect.
Start by preserving the source. Duplicate the workbook or create a separate analysis tab. Do not let an AI-generated cleanup overwrite the only copy of the original records.
Then check the structure:
- Use one header row with clear, unique column names.
- Keep one record per row and one field per column.
- Store dates, quantities, percentages, and currency values consistently.
- Remove decorative title rows and blank spacer rows from the analytical range.
- Identify duplicate records, missing values, and unusual entries without deleting them automatically.
- Separate raw data from calculated columns and summary tables.
- Add a short data dictionary for abbreviations, units, and business-specific terms.
A sales table, for example, might contain Order Date, Order ID, Region, Product, Units, Revenue, Cost, and Channel. If Revenue is recorded before tax in one source and after tax in another, state that distinction. If refunds are negative values, explain that convention. Gemini should not have to guess what a negative amount or blank cell means.
If the workbook contains several unrelated tables, give each table a clear title and consistent headers. Avoid putting a chart, notes, and transaction records in one undifferentiated range. When tables share identifiers such as Product ID or Customer ID, check that the identifiers use the same format before asking Gemini to compare them.
Step 2: Open Gemini and define the scope
On a computer, open the spreadsheet in Google Sheets and select the Gemini control at the top right. Depending on the feature available to your account, the side panel may present an Ask Gemini or Build workflow. Type a question or describe the change you want.
If the workbook has multiple tabs, use the source or tab selector in the side panel to focus Gemini on the relevant sheets. Google’s Help Center also explains that when a tab contains multiple tables, you can select the tables you want Gemini to consider. Narrowing the scope is especially useful when a workbook combines sales, inventory, returns, and staff records.
A vague prompt such as “Analyze this spreadsheet” leaves too many decisions open. A useful prompt identifies the data, the question, the comparison, and the expected output.
For example:
Analyze the sales table on the current tab.

Use Order Date, Region, Product, Units, Revenue, and Cost.
Calculate monthly revenue and gross margin by region.
Identify the three largest month-over-month changes.
Separate observations from possible explanations.
Show the calculation or source columns behind each result.
Do not delete or overwrite the original data.
This prompt gives Gemini a defined analytical task while asking it to distinguish an observed result from an explanation. That distinction matters: a drop in revenue is visible in the data, but the reason for the drop may not be.
Step 3: Ask focused questions before building a dashboard
Begin with a description of the dataset. Ask Gemini to summarize the columns, identify the date range, describe the number of records it can see, and flag fields that appear inconsistent or incomplete. Compare the response with the actual sheet. If Gemini overlooks a column or misunderstands a unit, correct the context before continuing.
Then move from general inspection to specific questions.
Find trends and changes over time
Using the selected sales table, summarize monthly revenue and units sold.
Compare each month with the previous month.
Identify the largest increases and decreases.
Show the months and values used in each comparison.
Do not infer causes that are not present in the data.
For time-series analysis, check that dates are real date values rather than text strings. Decide whether you want calendar months, fiscal periods, or rolling 30-day windows. A chart grouped by calendar month can tell a different story from one grouped by fiscal quarter.
Compare categories or regions
Compare total revenue, units sold, and gross margin by region.
Rank the regions by revenue.
Show the contribution of each region to the total.
Flag regions where revenue increased but gross margin fell.
Use the same date range for every region.
The final instruction prevents an unfair comparison if some regions have incomplete reporting periods. If one region has data for only ten months, do not compare its total directly with a region that has a full year without making the difference visible.
Investigate outliers
Review the selected table for unusually high or low values.
List the affected row identifiers, dates, and values.
Explain the rule used to flag each possible outlier.
Do not remove or change any records.
Separate data-entry errors from values that may be genuine.
An outlier is not automatically an error. A large order, unusual refund, or one-time expense may be real. Ask Gemini to identify candidates, then check the original record and any relevant business context.
Step 4: Analyze multiple tables and tabs
Gemini can be more useful when a workbook separates related information into structured tables. For example, a sales table may contain Order ID, Product ID, Quantity, and Date, while a product table contains Product ID, Category, and Unit Cost.
Google announced on October 20, 2025 that Gemini in Sheets could analyze multiple tables within a single tab. The original Workspace update describes generating formulas across tables, creating charts from combined data, applying changes across tables, and focusing analysis on selected ranges. Google’s current Help Center also documents selecting multiple tabs in a prompt and choosing specific tables when a tab contains more than one.
A practical prompt might be:
Use the Sales and Product tables.
Match records by Product ID.
Calculate revenue and estimated cost by product category.
List any Product IDs that do not match between the tables.
Do not assume that a missing match means zero cost.
Show the fields used in the calculation.
Before accepting the result, verify that the join key is unique where it needs to be unique. If a product table contains two rows for the same Product ID, a lookup or join can duplicate sales values. Ask Gemini to report unmatched keys and duplicate identifiers instead of silently choosing one record.
When you use more than one tab, state which tabs should be included and what relationship connects them. A request to “compare the tabs” is not a substitute for specifying whether the correct relationship is by date, order, customer, product, or another key.
For more on building spreadsheet workflows with another assistant, see our guide to using Copilot in Excel to summarize a large dataset.
Step 5: Generate formulas and check the logic
Gemini can generate formulas from plain English. You can ask for a formula in the side panel and provide the relevant column names or cell references. Google’s Help Center documents examples such as generating a lookup formula, inserting the suggested formula, and asking Gemini to diagnose an existing formula error.
For example, suppose Revenue is in column F and Cost is in column G. A gross-margin percentage formula for row 2 could be:
=IFERROR((F2-G2)/F2,0)
The formula is only appropriate if Revenue is non-zero and both columns use compatible units. Returning zero when revenue is zero may be convenient for a report, but it can hide the difference between a true zero margin and an undefined calculation. In some workbooks, returning a blank or an explicit status is safer.
A good formula-generation prompt should specify:
- The exact input columns or cell ranges.
- The desired output and unit.
- How blank cells should be treated.
- Whether negative values are valid.
- What should happen when a denominator is zero.
- Whether the formula should use relative or absolute references.
- Whether the result should be rounded, and to how many decimal places.
After Gemini suggests a formula, inspect the references and test it on a few rows where you can calculate the answer manually. Check the first row, a middle row, a blank or exceptional row, and the final row. Then compare the formula result with an independent total or a known sample.
Use Gemini to troubleshoot a formula error
When a cell displays a formula error, Google’s current Help Center describes a Fix action that lets Gemini inspect the formula and surrounding data structure, explain the likely issue, and suggest a corrected formula. Review the explanation and the replacement formula before relying on it. A corrected formula can still implement the wrong business rule. Google’s June 22, 2026 announcement about formula-error troubleshooting describes the feature’s rollout and eligibility.
You can also ask Gemini to explain a formula in plain English, identify the ranges it references, or compare two versions. If a formula is used in a financial or operational report, keep a note of the change and verify the result independently.
Step 6: Use the AI function for text analysis in cells
The AI function is useful when the task is to generate, summarize, or categorize text row by row. Google’s current Help Center documents both =AI() and =Gemini() as ways to call the function.
For example, if customer feedback is in cell D2, you could use:
=AI("Summarize this customer feedback in one sentence",D2)
For a controlled classification, define the allowed categories:
=AI("Classify this comment as Positive, Neutral, Negative, or Unclear. Return only one category.",D2)
The function can also use a supplied range, such as A2:D2, to summarize the fields in one record. After you enter the function, select the cell or cells and use Generate and Insert. Google also documents an AI column option for tables and a Fill workflow for extending generated content across a column.
There are important limits:
- The AI function returns text, not a numeric analysis or a chart.
- It does not have access to the entire spreadsheet or other Drive files. Pass the relevant data through the optional range argument.
- It is not designed to be embedded inside another function such as IF.
- If the source cells change, you may need to refresh or regenerate the output rather than assume it has updated.
- Google documents a limit of 350 selected AI-function cells generated at one time.
- Availability depends on the eligible plan, administrator settings, and language.
Do not use an AI-generated category as the sole basis for a high-impact decision. For customer sentiment, for example, review a sample of positive, negative, neutral, and ambiguous responses. If a comment contains sarcasm, multiple issues, or mixed sentiment, a single label may conceal useful information.
For the current syntax and limitations, consult Google’s Use the AI function in Google Sheets guide.
Step 7: Create a pivot table and chart
Once the questions and calculations are clear, ask Gemini to organize the results.
A pivot-table prompt could be:
Create a pivot table on a new sheet.
Use Region as rows and Month as columns.
Summarize Revenue by SUM.
Keep the original source table unchanged.
Use the same date range for every region.
For a chart, be explicit about the metric and axes:
Create a line chart of monthly revenue.
Put Month on the horizontal axis and Revenue on the vertical axis.
Use one series for each region.
Include a clear title and readable axis labels.
Do not combine revenue and units sold on the same scale.
Google’s Help Center explains that you can preview a generated chart, inspect its analysis steps, and insert it into the spreadsheet. It also documents an important limitation: a chart generated from the original dataset does not automatically respond to later changes in that source dataset. When inserted, the chart is placed on a new tab with its underlying data and remains editable, but it should not be treated as a live chart connected to the original range.
If the data changes regularly, decide how the report will be refreshed. You may need to regenerate the chart or create a conventional Sheets chart from a maintained summary range. BigQuery Connected Sheets is a different case: Google’s documentation says charts, pivot tables, formulas, and extracts created from connected BigQuery data can remain connected and be refreshed manually or on a schedule.
Step 8: Build an interactive dashboard with Sheets canvas
For a dashboard that should feel more like an application than a grid, consider Sheets canvas. Google describes canvas as a Gemini-powered layer that turns spreadsheet data into interactive visual layouts such as dashboards, heat maps, galleries, calendars, and Kanban boards.
You can ask Gemini to create a dashboard from a sheet, then refine its layout and functionality with follow-up prompts. Unlike a conventional static chart, canvas is read-write: people with edit access can add, change, or delete the underlying spreadsheet data through the canvas interface. Changes in the sheet are reflected in the canvas, and changes made through the canvas update the source sheet.
Canvas has specific constraints. Google’s current Help page says it is available in English, works on the web rather than the Sheets mobile app, and requires an eligible plan. It may not be available when the combined source data across tabs exceeds one million cells, or when the file is stored in third-party storage or is offline. The Help Center also notes that personal Google Accounts may have limited access to Canvas and Build.
A dashboard prompt could be:
Create an interactive dashboard from this tab.
Show total revenue, average order value, and gross margin.
Add a monthly trend view and a region filter.
Keep the underlying data visible through View data.
Do not change the source records while creating the dashboard.
Check the data behind every KPI. A visually polished dashboard can still contain a duplicated total, an incorrect denominator, or a misleading date range. If you publish a canvas beyond the original spreadsheet’s audience, review its sharing settings carefully: Google warns that the underlying data is sent to the browser and may be accessible to viewers of the published canvas.
Read Google’s Sheets canvas instructions before using it for a shared or externally visible dashboard.
Step 9: Analyze larger datasets with BigQuery Connected Sheets
A standard spreadsheet is not always the right place to store or process a very large dataset. If the source data is already in BigQuery, Connected Sheets can let Gemini help explore that data from Google Sheets without treating the spreadsheet as the entire data warehouse.
Google’s BigQuery Connected Sheets guide describes asking questions about BigQuery data, exploring trends, and building charts, pivot tables, formulas, and extracts across the connected dataset. The same documentation states that Gemini runs read-only queries on the connected BigQuery source; it does not modify or delete the data in BigQuery. You still need the appropriate BigQuery access and a Google Cloud billing project to run queries.
This approach is useful when the dataset is too large or frequently refreshed for a manually copied spreadsheet. It is not a way to bypass access controls. A collaborator may be able to view saved results in a sheet without having permission to run a new BigQuery query or refresh the connected data.
For smaller operational datasets, a normal Sheets table is usually easier to maintain. Use BigQuery when the source, permissions, refresh requirements, and scale justify it.
Step 10: Verify the analysis before sharing it
The final review is the most important part of an AI-assisted spreadsheet workflow. Gemini can make a complex task easier, but its output still needs data-quality and logic checks.
Use this review sequence:
- Check the scope. Confirm that the intended tabs, tables, rows, and date range were included.
- Check the definitions. Confirm that revenue, margin, units, returns, and other metrics mean what your organization says they mean.
- Check the calculations. Recalculate key totals and percentages independently.
- Check missing values. Make sure blanks were not silently treated as zeros or omitted from a denominator.
- Check duplicates. Confirm that joins and lookups did not multiply records.
- Check filters. Verify that hidden filters, selected ranges, or excluded periods did not change the comparison.
- Check chart design. Confirm the units, axis scale, labels, and time intervals.
- Check refresh behavior. Know whether the output is static, manually refreshed, or connected to a live source.
- Keep a record. Save the prompt, the generated formula or action, and any manual correction that affects the result.
For multi-step actions, read the action preview before selecting Apply. Google’s Help Center documents an Undo option for supported side-panel actions, but it may only remain available until further changes are made. Keep a separate copy before a large cleanup or transformation.
The same discipline applies to AI-generated explanations. Ask Gemini to separate what the spreadsheet shows from what might explain it. “Revenue fell by 8% in March” is a measurable observation. “The campaign caused the decline” is a causal claim that requires evidence beyond the revenue column.
Privacy and responsible use
Before sending a workbook to Gemini, check the data classification and the rules that apply to your Google account. Remove personal identifiers, confidential customer details, payroll information, credentials, and other sensitive fields unless the organization has approved the specific workflow.
Google’s Workspace Gemini data-protection guide explains its privacy commitments for Workspace services. Google states that Workspace content used by Gemini in Workspace apps is not used to train or improve the underlying generative AI models, and that prompts and generated output are not stored without permission for users with Google AI plans. Users enrolled in Workspace Experiments are covered by a separate privacy notice. Check the terms that apply to your account rather than assuming that every Google account, add-on, or experimental feature has identical protections.
Gemini’s own suggestions may be inaccurate or unsuitable. Google advises users not to rely on these features as professional financial, legal, medical, or other expert advice. For financial statements, regulatory reporting, payroll, or decisions that materially affect people, use an established review and approval process.
Practical prompt library for Google Sheets data analysis
The following prompts can be adapted to sales, finance, inventory, customer feedback, operations, or project tracking. Replace the example fields with the exact column names in your workbook.
1. Understand a new dataset
Summarize the selected table.
List the columns, likely data types, date coverage, missing values, and possible duplicates.
Flag anything that needs a human definition.
Do not modify the data.
2. Find the main trends
Analyze the selected data by month.
Show the largest increases and decreases, the periods involved, and the values used.
Separate measured trends from possible explanations.
3. Compare categories
Compare total revenue and gross margin by product category.
Rank the categories by revenue.
Show each category's share of the total and identify missing or inconsistent values.
4. Review customer feedback
Summarize the main themes in the selected feedback.
Classify each row as Positive, Neutral, Negative, or Mixed.
Preserve the original comment and flag ambiguous cases for manual review.
5. Check data quality
Inspect this table for duplicate IDs, missing dates, invalid quantities, and inconsistent category names.
Return the affected row IDs and the reason each row was flagged.
Do not delete or overwrite records.
6. Create an executive summary
Prepare a concise summary of this dataset for a management review.
Include the three most important metrics, the strongest trend, the largest exception, and the main limitation.
Show the source fields behind every number.
Frequently asked questions
Can Gemini analyze an existing Google Sheets spreadsheet?
Yes. Google’s Help Center documents using the Gemini side panel to summarize a spreadsheet, answer questions about its data, generate formulas, create charts, and perform supported editing actions. The exact features depend on account eligibility and settings.
Can Gemini analyze an Excel file in Google Sheets?
For the newer Build workflow, Google says native Sheets files work best. Convert an Excel workbook with File → Save as Google Sheets, then check the converted formulas, formatting, named ranges, and links before using Gemini. Keep the original file until the conversion is verified.
Can Gemini analyze more than one table?
Yes. Google announced multiple-table analysis in October 2025. You can focus Gemini on selected tables within a tab, and the current Help Center also documents selecting multiple tabs in a prompt. Clearly state how the tables relate and which identifiers should be used to match them.
Can Gemini create charts and pivot tables?
Yes. Gemini can generate charts and pivot tables from spreadsheet data. Review the output before inserting it. A chart generated from a normal source dataset does not automatically update when that original dataset changes; connected BigQuery outputs have separate refresh behavior.
Can Gemini generate formulas from plain English?
Yes. You can describe the calculation, supply the relevant columns or cell references, and ask Gemini to generate a formula. Verify the references, treatment of blanks, zero values, and edge cases before using it in a report.
What is the difference between Gemini in Sheets and the AI function?
The side panel can analyze spreadsheet data and perform a range of spreadsheet actions. The AI function works inside cells to generate, summarize, or categorize text from a range you pass to it. The AI function returns text and does not have access to the entire spreadsheet or other Drive files.
Can Gemini analyze a very large dataset?
For data stored in BigQuery, Gemini can work through Connected Sheets with the required permissions and billing project. Standard Sheets analysis and Sheets canvas have their own data and feature limits. Choose the storage and analysis method based on the dataset’s size and refresh needs.
Final thoughts
Gemini makes Google Sheets more approachable for people who need to explore data without writing every formula or building every chart manually. It can summarize a workbook, compare tables, suggest calculations, create visualizations, and help turn a structured dataset into a useful dashboard.
The reliable process is still deliberate: prepare the data, define the question, limit the analysis to the right sources, review the proposed actions, and verify the calculations before sharing the result. Used that way, Gemini in Google Sheets can shorten the path from raw rows to useful analysis without removing the need for sound spreadsheet judgment.