
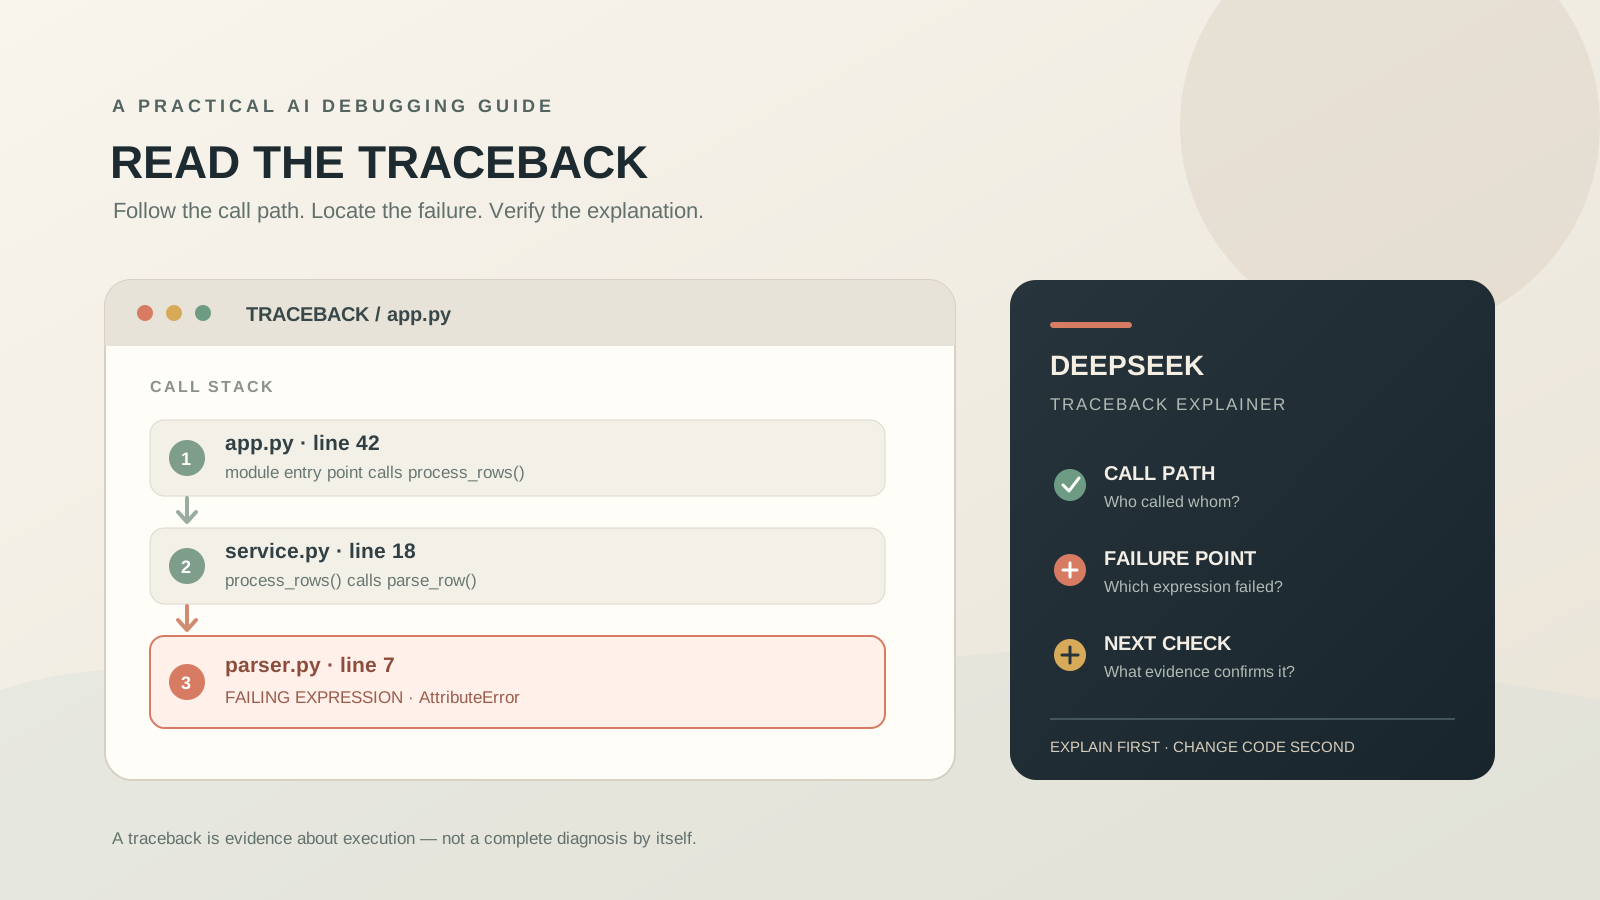
A Python traceback is more than an error message. It is a record of the calls that were active when an exception escaped, the source locations associated with those calls, and the exception Python ultimately reported. The difficulty is that a traceback is written for developers who already know how to read a call stack. When several functions, files, or library calls are involved, it can be hard to see how the lines fit together.
DeepSeek can help translate a Python traceback into a step-by-step explanation: which function called the next one, where the exception surfaced, what the final exception type means, and which parts of the diagnosis are supported by the code you supplied. The most useful approach is to ask for an explanation before asking for a repair. That keeps the evidence separate from guesses about how the program should behave.
This guide focuses specifically on understanding a traceback, not on having an AI assistant rewrite a Python project. For the broader process of reproducing a bug, applying a minimal patch, and writing regression tests, see our guide to using DeepSeek to debug Python code step by step.
What a Python traceback actually tells you
When an unhandled exception occurs, Python normally prints a traceback followed by the exception type and its message. The traceback shows the execution path that led to the failure. It does not necessarily explain the design mistake that allowed the failure to happen.
A standard traceback contains several kinds of information:
- The traceback heading indicates that Python is displaying the call history for an exception.
- A file and line entry identifies a source location associated with one active stack frame.
- The function name tells you which function was executing in that frame. The name may be the top-level module when execution is at the top level, or a generated name such as a generator-expression frame.
- The source line, when available, shows the statement associated with the frame.
- The final exception line gives the exception class and its message.
The familiar heading, “Traceback (most recent call last):”, is an important reading clue. The frames are printed from the outer call toward the most recent call. In practical terms, read the displayed frames from bottom to top when you want to follow the path toward the failing operation. The final frame is usually the innermost location where the exception was raised or surfaced. It is not automatically the full root cause: the bad value may have been created several calls earlier.
Python’s official tutorial distinguishes syntax errors from exceptions. A syntax error is detected while Python parses code; an exception occurs while a syntactically valid statement is being executed. The distinction matters because the information available in their messages is different. See the Python tutorial on errors and exceptions.
Understand the stack frames before interpreting the final error
Consider this small example:
def parse_quantity(row):
    return int(row["quantity"].strip())

def total_items(rows):
    return sum(parse_quantity(row) for row in rows)

records = [
    {"quantity": "2"},
    {"quantity": None},
]

print(total_items(records))
The program fails because the second record contains None for quantity. The function calls the string method strip on that value, but None does not provide a method named strip.
An illustrative traceback for this example looks like this:
Traceback (most recent call last):
  File "app.py", line 11, in <module>
    print(total_items(records))
          ^^^^^^^^^^^^^^^^^^^^^
  File "app.py", line 5, in total_items
    return sum(parse_quantity(row) for row in rows)
           ^^^^^^^^^^^^^^^^^^^^^^^^^^^^^^^^^^^^^^^^
  File "app.py", line 5, in <genexpr>
    return sum(parse_quantity(row) for row in rows)
               ^^^^^^^^^^^^^^^^^^^
  File "app.py", line 2, in parse_quantity
    return int(row["quantity"].strip())
               ^^^^^^^^^^^^^^^^^^^^^
AttributeError: 'NoneType' object has no attribute 'strip'
The exact caret markers and formatting depend on the Python version and execution environment. The important point is the sequence of frames:
- The module frame shows the top-level statement that called total_items.
- The total_items frame shows that the function was evaluating a generator expression while passing values to sum.
- The generator-expression frame shows the call to parse_quantity for an item in the input.
- The parse_quantity frame identifies the expression that attempted to call strip.
The final line, AttributeError: ‘NoneType’ object has no attribute ‘strip’, tells you that the object receiving the method call was None. The traceback and the supplied source code together make the explanation stronger than either one alone.
Notice what the traceback does not tell you by itself: it does not establish whether a missing quantity should be rejected, treated as zero, skipped, or represented in another way. That is a requirement of the application. DeepSeek should explain the execution evidence first and ask for clarification if the intended behavior is unknown.
Step 1: Capture the complete traceback
Run the program again and copy the complete output from the traceback heading through the final exception line. Do not copy only the last line.
The earlier frames can be essential. A TypeError in a library call, for example, may be the result of a value created by your own code several functions earlier. If you provide only the exception name, DeepSeek has little basis for reconstructing the call path.
If the terminal output is long, preserve the full traceback in a text file. Keep the original line breaks and indentation. Do not remove file names, function names, line numbers, exception-chain messages, or source excerpts just to make the prompt shorter.
If the traceback is produced by a notebook, web server, background worker, or test runner, also identify that environment. Some tools wrap exceptions or display only part of the original error. Tell DeepSeek whether the output came from a normal Python script, Jupyter, pytest, a web framework, or another runtime.
Step 2: Give DeepSeek the code around the reported lines
A traceback is a map of execution, not a copy of the entire program. DeepSeek needs enough source context to understand what each relevant frame was doing.
Provide:
- The function containing the final frame.
- The function that called it, if that call appears in the traceback.
- The input shape or a small sanitized example of the input.
- The Python version and relevant package versions.
- The exact command or action that produced the error, if it matters.
- What you expected to happen, if the expected behavior is relevant to the explanation.
Start with the smallest code sample that preserves the failure. If the traceback refers to several project files, label each code excerpt with its file name. Do not paste unrelated modules simply because they belong to the same project.
Before sharing source code or logs with an online AI service, remove API keys, passwords, session tokens, private URLs, customer information, and other confidential values. Replace sensitive data with clearly labelled placeholders while preserving the data types and structure that matter to the error.
Step 3: Ask DeepSeek for a line-by-line explanation
Open the official DeepSeek website and start a conversation. The exact model choices and interface controls can change, so use the options currently available in your account. Paste the traceback and the relevant source excerpts, then ask for an explanation without a proposed fix.
A useful prompt is:
Explain this Python traceback line by line. Do not propose a code fix yet.

Please:
1. Explain what the final exception type and message mean.
2. List the stack frames in execution order, from the outermost call
   to the innermost frame.
3. For each frame, identify the file, line, function, and operation
   shown by the supplied traceback.
4. Explain how control moved from one frame to the next.
5. Identify the exact expression where the exception surfaced.
6. Separate facts visible in the traceback or code from hypotheses.
7. State what additional information is missing if the root cause
   cannot be established.

Python version:
[version]

Relevant source code:
[paste labelled code excerpts]

Complete traceback:
[paste the complete traceback]

Expected behavior:
[describe it, or say that it is not yet known]
This prompt asks DeepSeek to produce a traceable explanation rather than a confident-sounding repair. Check that its frame list matches the order and locations in the original output. If it names a file, function, variable, or line that is not present in the supplied material, ask it to identify the evidence or correct the claim.
Step 4: Separate the exception from the underlying cause
The final exception line is often the clearest description of what Python could not do, but it may not explain why the program reached that state.
For example:
| Exception | What the message commonly indicates | What to inspect next |
|---|---|---|
| AttributeError | An object does not provide the requested attribute or method | The object’s actual type and where it was assigned |
| TypeError | An operation received an incompatible type or an invalid argument pattern | The values and types passed into the operation |
| NameError | A name could not be found in the relevant scope | Definitions, imports, spelling, and scope |
| KeyError | A mapping does not contain the requested key | The actual keys and the input schema |
| IndexError | A sequence index is outside its valid range | The sequence length and index calculation |
| ValueError | A value is unsuitable for an operation even though its general type may be acceptable | The value’s format and the function’s requirements |
| ZeroDivisionError | A division operation used zero as its denominator | The calculation that produced the denominator |
Ask DeepSeek to explain the exception in the context of the source code, not to infer a complete application requirement from the exception name. A KeyError, for example, might indicate malformed input, a misspelled key, or a missing required field. Replacing dictionary access with get is not automatically correct; it may simply hide a data-contract violation.
A good follow-up is:
You have explained what the exception means.
Now distinguish:
- the immediate operation that failed;
- the value or condition that made it fail;
- the earlier code that may have introduced that condition;
- the evidence that supports each conclusion.

Do not choose a business rule or expected behavior that I have not supplied.
This distinction is useful when the last frame is only where a bad value was used. The value may have been read from a file, returned by an API, transformed by another function, or loaded from a database much earlier.
Step 5: Ask about Python’s error-location markers
Modern Python tracebacks can show more than a line number. Starting with Python 3.11, CPython can include fine-grained source positions that underline or mark the expression associated with the failing instruction. This behavior is described in PEP 657: Include Fine Grained Error Locations in Tracebacks.
These markers are useful when a line contains several operations. If a statement accesses nested dictionaries, calls multiple functions, or combines several expressions, the highlighted range can narrow down which part was executing when the exception occurred.
Ask DeepSeek to explain the highlighted range separately from the entire source line. For example:
The traceback includes an underlined expression.
Explain what that marker identifies and what it does not prove.
If the highlighted expression contains multiple operations,
break them down in evaluation order.
Do not assume that the marker identifies the earlier source of
the bad value.
Do not assume every traceback will contain these markers. The Python version, interpreter build, runtime, and formatting tool can affect what is displayed. If a marker is absent, the file and line information are still useful.
Syntax errors need a different interpretation. Python’s parser may point to where it detected that the grammar no longer made sense, not necessarily to the exact character that should be changed. The official tutorial demonstrates a missing colon where the reported position is near the following statement. Ask DeepSeek to inspect the preceding syntax as well as the marked token.
Step 6: Recognize chained exceptions
Some tracebacks contain more than one exception. Two messages are especially important:
- “During handling of the above exception, another exception occurred:”
- “The above exception was the direct cause of the following exception:”
These indicate exception chaining. Python can retain the earlier exception as context when another exception is raised while handling it. A programmer can also explicitly declare a cause with a raise-from statement. The official documentation describes the difference between implicit context and explicit causes in Built-in Exceptions.
When DeepSeek sees a chained traceback, ask it to explain each exception separately before connecting them:
This traceback contains chained exceptions.
For each exception:
1. Give its type and message.
2. Identify its own stack frames.
3. Explain whether Python reports it as an earlier context
   or an explicit direct cause.
4. Explain how it relates to the final exception.
5. Do not treat the first exception as irrelevant.

Then summarize the complete sequence without omitting either failure.
The first exception may reveal the original failure, while the final exception may describe how the application translated or wrapped it. If DeepSeek discusses only the last line, ask it to revisit the entire chain.
Step 7: Handle generated frames and grouped failures carefully
Not every frame corresponds to a function that you wrote. Tracebacks can include generated contexts such as generator expressions, comprehensions, callbacks, framework code, and library internals. Ask DeepSeek to label which frames belong to your application and which appear to come from the Python runtime or a dependency.
Python 3.11 also introduced exception groups, which allow multiple exceptions to be reported together. If the output contains an ExceptionGroup or nested exception sections, do not ask DeepSeek to compress everything into one cause. Ask for a separate explanation of each contained exception and the common operation that allowed them to occur together.
The standard library’s traceback module provides functions for extracting, formatting, and printing traceback information. Its documentation also explains that formatted output can include chained exceptions. This is useful background when a traceback has been captured by a test runner or application rather than printed directly by the interpreter.
Step 8: Verify the explanation in Python
An AI explanation is a hypothesis until it matches the source code and the program’s actual behavior. Use the reported file and line numbers to inspect the local project. Confirm that the source version you are reading is the same version that produced the traceback; line numbers can change after edits or when code is deployed from a different revision.
For a suspected value problem, inspect the value and its type at the relevant boundary. For the earlier example, a temporary diagnostic could be:
value = row["quantity"]
print("quantity type:", type(value).__name__)
print("quantity value:", repr(value))
Use this only with non-sensitive test data. Debug output can expose information, and printing a full object may reveal credentials or personal data.
If the traceback is difficult to reproduce, use a debugger or a focused test to stop near the reported operation. You can also use Python’s standard traceback module to capture or format exception information in code. For a broader workflow that moves from diagnosis to a tested correction, continue with our DeepSeek Python debugging guide. If you want to compare another AI-assisted testing workflow, see how to use Qwen to debug Python code with test cases.
Do not ask DeepSeek to claim that a program ran successfully unless you actually ran it in the relevant environment and supplied the output. A model can explain a traceback from text; that is not the same as executing your application, accessing your local files, or reproducing the failure.
Can you attach a Python file to DeepSeek?
For a short example, pasting the relevant source code and traceback is usually the simplest method. If you are working with a larger source file, check the file-input options available in the interface you use and avoid uploading an entire project when a few functions are sufficient.
There is also a documented developer route. DeepSeek’s API documentation describes file input for its chat APIs. The Files API accepts plain-text files, including source-code files, through the user_data purpose; the returned file identifier can then be referenced in a chat request. The current file-parsing guide explains the supported formats and limits. This is an API workflow for developers, not a guarantee that every consumer interface exposes identical upload controls.
DeepSeek’s changelog dated November 13, 2026 says that the application-style API capabilities include file input and URL reading, alongside web search and other tools. For current implementation details, consult the DeepSeek API changelog, Files API documentation, and File Parsing guide. The API reference currently documents the deepseek-flash model for the file-parsing workflow. Confirm the current model and interface requirements before building an integration.
Common mistakes when asking DeepSeek to explain a traceback
Pasting only the final exception line. This removes the call history that often explains how execution reached the failing operation. Provide the complete traceback.
Treating every frame as the bug. Earlier frames show the call path. The innermost frame often shows where the exception surfaced, but the bad state may have originated earlier.
Asking for a fix before asking for an explanation. A rewrite can obscure the original failure. First ask for a frame-by-frame account and the evidence behind the diagnosis.
Leaving out the relevant source code. A traceback may show a line, but the model may not know the surrounding variable assignments, input structure, or function contract. Provide a small, labelled excerpt.
Ignoring the Python version. Error markers, formatting, and available language features can differ. Include the version reported by your environment.
Accepting an invented value or requirement. If the traceback does not reveal what a variable contained, DeepSeek should say so. Verify the value locally rather than treating a plausible guess as a fact.
Sharing secrets in logs or source files. Remove credentials, personal information, and confidential records before using an online assistant.
Frequently asked questions
Can DeepSeek explain a Python traceback?
Yes. You can provide the complete traceback and relevant source code, then ask DeepSeek to explain the stack frames, exception type, failing expression, and any chained exceptions. Check its interpretation against the actual source and runtime output.
Should I paste the whole Python project?
Usually not. Start with the complete traceback and the smallest set of functions or files needed to explain the reported frames. Add more context only when the first explanation identifies a specific missing dependency or call site.
Does the last line of a traceback always show the root cause?
The final line identifies the exception that was ultimately reported. The last displayed frame usually identifies where it surfaced. The underlying cause may be an earlier value assignment, input, or call, so inspect the preceding frames and relevant source.
Why does Python underline part of a traceback line?
Python 3.11 introduced fine-grained error locations through PEP 657. The markers can identify the expression associated with the failing instruction. They help narrow the location, but they do not necessarily show where an invalid value originated.
Can DeepSeek run my Python code to confirm its explanation?
Do not assume a chat response has executed your local program. Unless the specific tool or environment you are using has an execution capability and provides real output, treat the answer as an explanation based on the material you supplied. Run the code and tests in your own environment.
Is a traceback the same as a syntax error?
No. A traceback commonly accompanies an exception raised during execution. A syntax error is detected while Python parses source code. Both can identify a file and location, but the cause and diagnostic process are different.
Conclusion: Use DeepSeek to read the evidence, not replace it
The most effective way to use DeepSeek to explain a Python traceback is to preserve the complete output, supply the source around the reported frames, and ask for a line-by-line account before requesting a code change. A useful explanation should connect the call path to the final exception, distinguish what the traceback proves from what remains uncertain, and identify the next fact to verify.
DeepSeek can make an unfamiliar stack trace easier to understand, especially when several functions or files are involved. The final responsibility remains with the developer: inspect the relevant code, reproduce the behavior, confirm runtime values, and test any correction in the environment that actually runs the program.